This is an analysis of a dataset from the District of Columbia Metropolitan Police Department.
The District of Columbia Metropolitan Police Department reported that the capital had 8,540 crime incidents as of the first week of April this year.
In the first three months, Washington had 7,398 crime incidents, which was similar to the number of incidents appeared in the first quarter of 2016 – 7,482, according to the MPD data. A total of 35,252 cases were reported in 2016.
Theft is the most common crime handled by the police so far this year, with 3,759 general theft cases, 2,585 theft incidents happened from within a vehicle, and 556 motor vehicle theft cases reported as of April 10.
Among other crime offenses – 570 cases were related to robbery, 529 cases were assaults with dangerous weapon, 436 were burglary, 72 incidents were sex abuse, 32 cases reported to be homicide, and one case was arson.
So far this year, the violent crimes, including homicide, sex abuse, assault with dangerous weapon, and robbery, decreased 24 percent during the same period in last year; while the property crimes, including burglary, theft, and arson, were down four percent.
Washington was known as the “murder capital” in the 1990s due to its large number of homicide incidents.
In 1990, Washington peaked its number of slayings to 474, according to the Washington Post. However, the crime rate started to fall as the economy improved and government’s attentions to the issue.
Last year, 136 homicide cases were filed, representing a 17 percent decline compared to the previous year.
The police’s clearance rate on homicide incidents has maintained at a level above 60 percent in the past decade or so – the police solved 62 percent of such cases in 2015, and 60.7 percent of the 196 homicides in 2005 – according to the MPD.
As to the locations of the crimes this year, there were some business areas that reported to have more crimes than the other.
Downtown had 520 crimes in the first four months, the highest in the 10 official Business Improvement Districts in Washington, following by the Capitol Hill (180), Georgetown (168), Golden Triangle (151), NoMa (129), Southwest (107), Mount Vernon Triangle (96), Capitol Riverfront (76), Adams Morgan (70) and Anacostia (40).
Most crimes in these business districts happened at night as the statistics showed that the evening shift of the police, from 3 p.m. to 11p.m., received the most crime cases, while the midnight shift (11 p.m.- 7 a.m.) tended to get the least.
| Ward | Crime Incidents |
|---|---|
| 2 | 1543 |
| 6 | 1391 |
| 5 | 1211 |
| 1 | 1199 |
| 7 | 1068 |
| 8 | 950 |
| 4 | 755 |
| 3 | 423 |
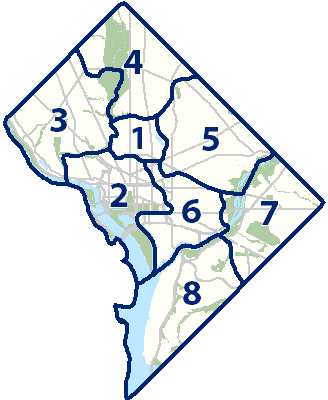
Around the central part of Washington topped the crime list among the eight wards, with 1,543 incidents happened in the Ward 2, 1,391 in the Ward 6, 1,211 in the Ward 5, and 1,199 in the Ward 1.
Map credit: Office of Planning, DC.gov